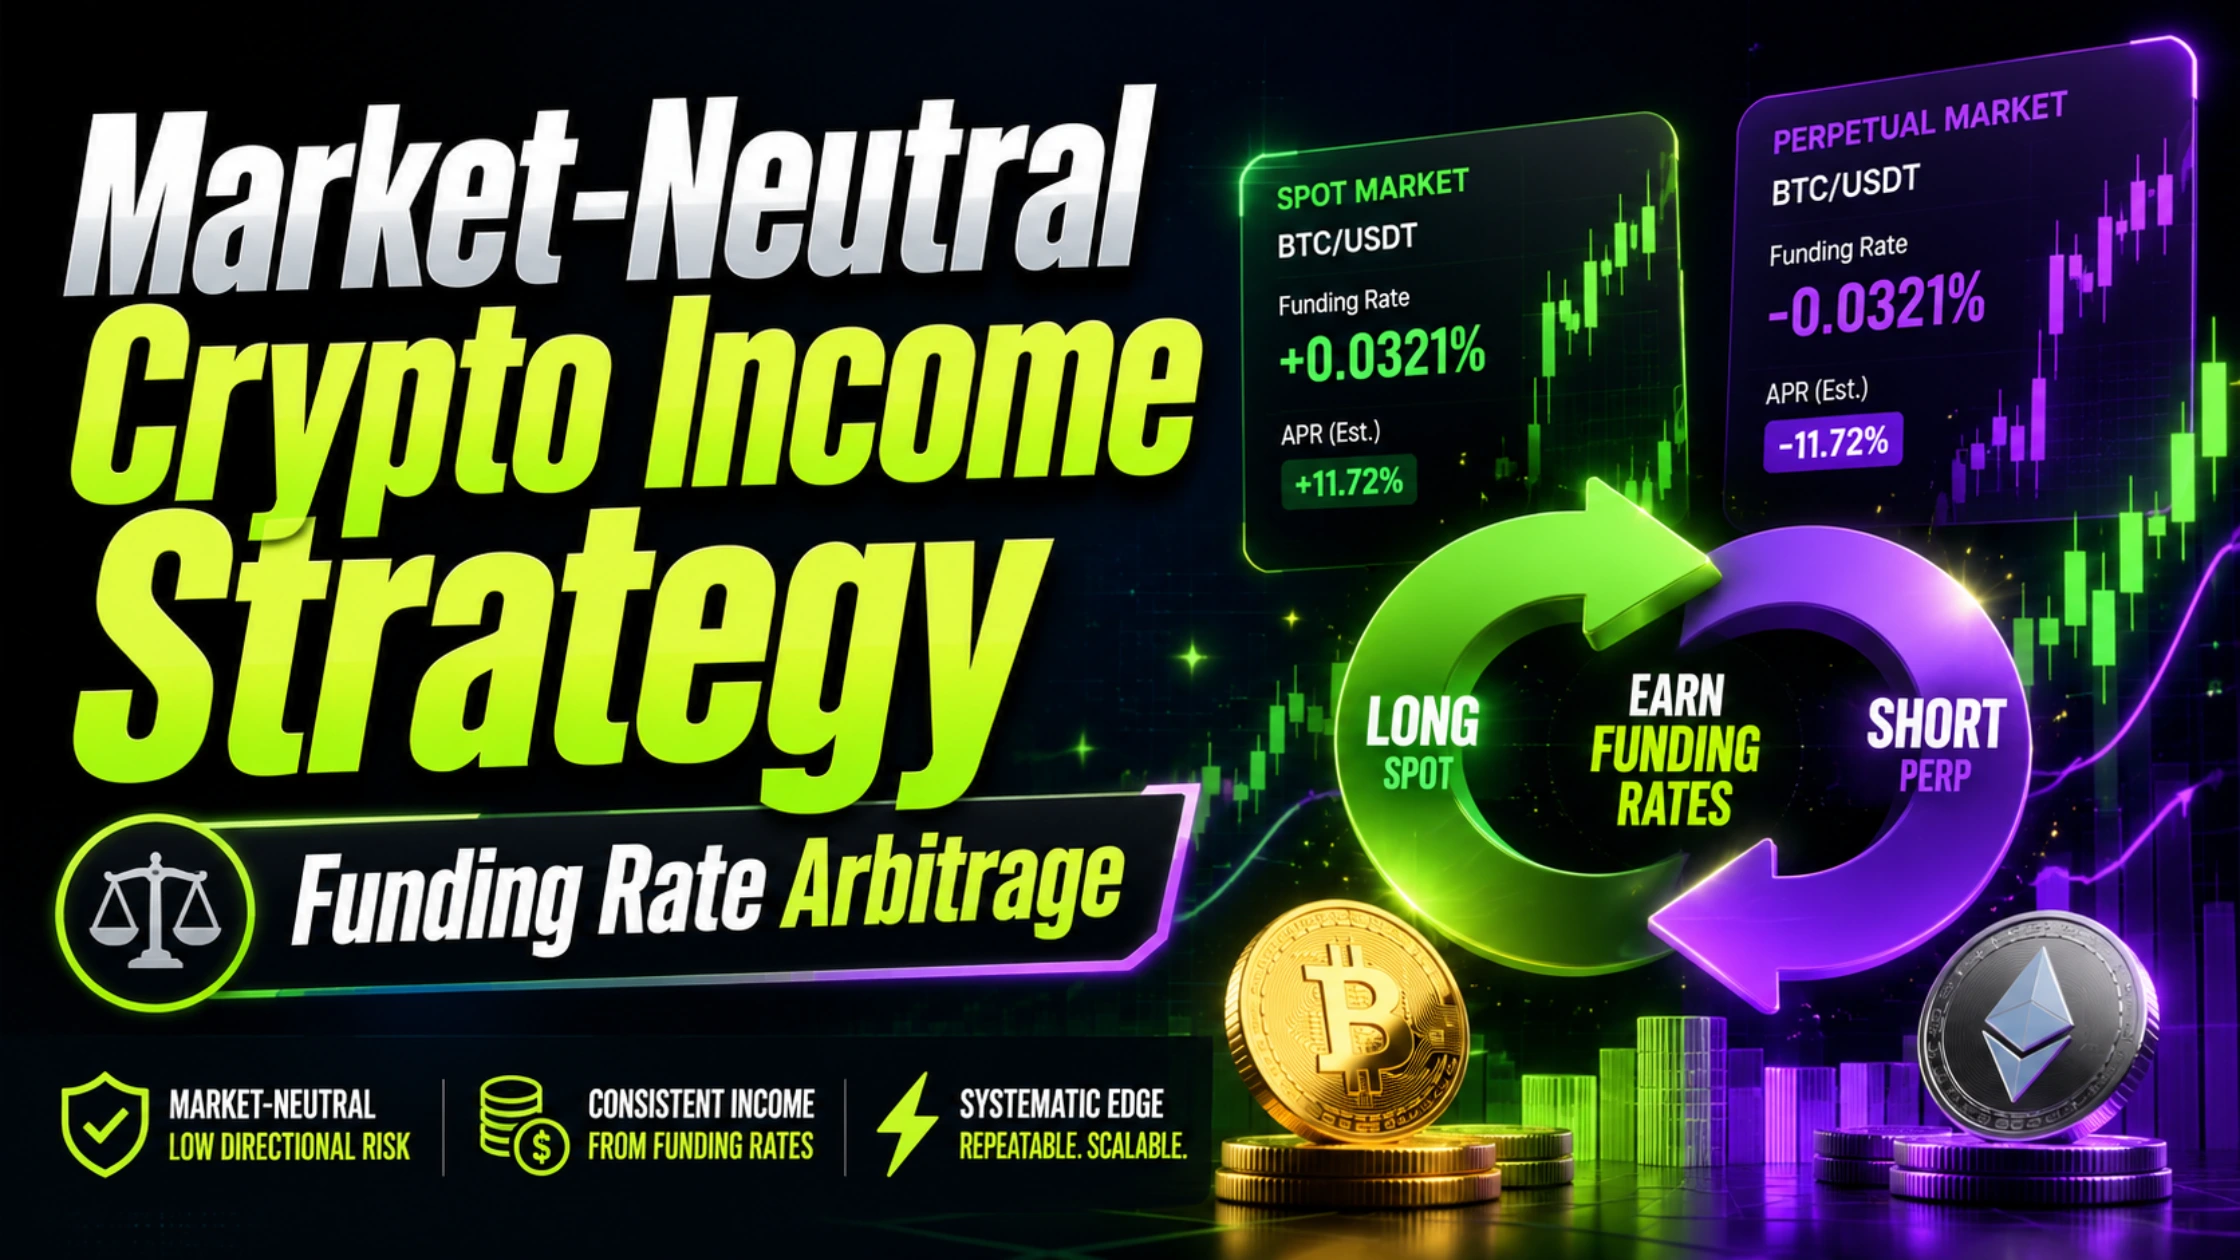
How funding arbitrage works
Funding rate arbitrage is a strategy that captures the yield differential between spot and perpetual futures markets. In crypto, perpetual contracts do not have an expiration date, so exchanges use a funding rate mechanism to keep the futures price tethered to the spot price. When the market is bullish, longs pay shorts; when bearish, shorts pay longs. This mechanism creates a predictable, periodic cash flow that traders can harvest.
The core mechanism is straightforward: you go long on the spot market and short the perpetual futures market simultaneously. This structure is delta-neutral, meaning your exposure to the underlying asset's price movement is hedged. If Bitcoin rises, your spot holdings gain value, but your short futures position loses an equivalent amount. Conversely, if Bitcoin falls, your spot loses value while your short position gains. The net PnL from price action is effectively zero.
Your profit comes entirely from the funding payments. In a typical bull market, the funding rate is positive, meaning long positions pay short positions. By holding the short futures position, you collect these payments every eight hours (on most major exchanges) from the leveraged longs who are betting on further upside. This yield exists because the premium paid by leveraged traders in the futures market often exceeds the cost of borrowing or holding the spot asset.
While the concept mirrors traditional cash-and-carry arbitrage, crypto funding rates can be significantly higher due to the prevalence of leveraged trading and the 24/7 nature of the market. This accessibility allows retail and institutional traders alike to participate in a strategy that was previously dominated by high-frequency trading firms with direct market access.
Market data and scanner tools
Funding arbitrage relies on speed and precision. If your data feed lags by even a few seconds, the opportunity may vanish or turn into a loss. The infrastructure for finding these opportunities centers on real-time data aggregation and cross-exchange comparison. You need tools that slice through market noise to show you exactly where the funding rate spreads are widest.
The landscape is split between specialized scanners and broader analytics platforms. Specialized tools like Arbitrage Scanner focus exclusively on funding rates across multiple venues, offering granular alerts for specific assets. Broader platforms like CoinGlass provide funding data as part of a larger suite of derivatives analytics, which can be useful if you are already monitoring open interest or liquidation heatmaps.
The choice depends on your workflow. If you are running an automated bot, you need low-latency API access. If you are trading manually, a visual dashboard with clear alerts is more practical. Below is a comparison of the primary tools used to track these spreads.

| Tool | Primary Focus | Exchange Coverage | Alert System |
|---|---|---|---|
| Arbitrage Scanner | Funding rates only | Binance, OKX, Bybit, Bitget, Dydx, Bitmex | Real-time notifications |
| CoinGlass | Derivatives analytics | Major centralized exchanges | Customizable dashboard alerts |
| Coinglass | Market sentiment | Wide range of exchanges | Price and volume alerts |


As an Amazon Associate, we may earn from qualifying purchases.
Exchange selection and infrastructure
The math of funding arb looks clean on paper, but the execution lives or dies on exchange infrastructure. A spread that promises 20% annualized yield can evaporate if withdrawal fees eat the margin or if a platform’s withdrawal limits prevent timely rebalancing. You are not just trading the rate; you are trading the friction between two venues.
Margin and withdrawal realities
Most arbitrageurs use perpetual futures, which require initial margin. The leverage you choose dictates how much capital is locked up. If you use 5x leverage, you need five times the position value in margin. This capital is illiquid until you close the trade.
Withdrawal fees are the silent killer. If you need to move collateral between exchanges to cover a margin call, a $10 Bitcoin withdrawal fee on a $1,000 position is a 1% hit. On a $100,000 position, it is negligible. Always calculate the fee impact on your specific trade size before entering. Low-fee, high-volume exchanges are preferred for the leg that requires frequent rebalancing.
Counterparty risk management
In a basis trade, you are long one exchange and short another. If one exchange halts withdrawals or faces insolvency, your hedge vanishes. You are left with a naked long position in a falling market. This is not theoretical risk; it is the primary danger of cross-exchange arbitrage.
Diversify across at least two major, regulated venues. Never keep all your arbitrage capital on a single platform. Monitor the exchange’s health indicators: withdrawal status, order book depth, and recent security incidents. A quick check of the exchange’s official status page is cheaper than a total loss.
Tracking the live rate
Funding rates change every 8 hours (or more frequently on some platforms). You need real-time data to know if the spread is still profitable after fees. Static data is useless. Use a live price feed to monitor the underlying asset volatility, which can trigger liquidations if your margin is too thin.
Timing your entry with technical indicators
Technical analysis in funding arbitrage isn't about predicting the next big pump; it's about identifying when the market is overextended. The goal is to enter when funding rates are high but showing signs of exhaustion, and to exit before mean reversion squeezes your margin. Using the right charts helps you spot these inflection points before they become obvious to the broader market.
Reading the divergence
The most reliable signal in funding arb is divergence between price and funding rates. When Bitcoin makes a new high but funding rates fail to follow, it suggests the long position is overcrowded and vulnerable to a flush. Conversely, if funding rates remain stubbornly high while the price consolidates, the premium is likely sustainable for now. Watch for the moment when funding spikes above historical averages while price action stalls—that's your entry window.
Using the funding rate chart
Funding rate charts are your primary tool for timing. Look for rates that exceed 0.1% per 8 hours on major exchanges as a warning sign of overheating. When rates climb above 0.5%, the risk of a sharp correction increases significantly. Enter positions when rates are elevated but beginning to plateau, and set exit targets when rates drop back toward the mean. This approach minimizes the risk of getting caught in a sudden reversal.
Avoiding the squeeze
The biggest risk in funding arb is the squeeze. When funding rates spike too high, market makers and arbitrageurs step in to close positions, causing a rapid price drop. To avoid this, never enter when funding rates are at their absolute peak. Instead, wait for the first sign of cooling—when the rate begins to decline even slightly. This gives you a buffer against sudden reversals and ensures your position isn't caught in the initial flush.
Risk management and exit strategies
Funding arbitrage sounds like free money until an exchange halts withdrawals or a liquidation cascade forces you to close at a loss. The strategy relies on two legs: a spot position and a short perpetual position. If one leg breaks, the "risk-free" trade becomes a directional bet with leverage. You need a checklist that assumes the worst will happen, not just that it might.
Never lock up capital on an exchange with opaque reserves. Check for public proof-of-reserves reports and monitor withdrawal queues. If an exchange has a history of halting withdrawals during high volatility, treat it as a single point of failure. Diversify your capital across at least two reputable venues to mitigate counterparty risk.
The profit in funding arb comes from the spread between the spot price and the perpetual price. If this basis widens against you, your unrealized losses grow even if you are collecting positive funding payments. Set strict stop-loss orders on the perpetual leg. Do not rely on the funding payments to cover a widening basis indefinitely; the market can stay irrational longer than you can stay solvent.
In crypto markets, a sharp drop in spot prices can trigger a cascade of long liquidations, often dragging the perpetual price down further due to forced selling. This can cause a "flash crash" where your short position profits, but your spot position loses value faster than the funding payments can offset. Ensure your margin ratios are healthy enough to survive a 10-20% sudden move without getting margin called.
No comments yet. Be the first to share your thoughts!